

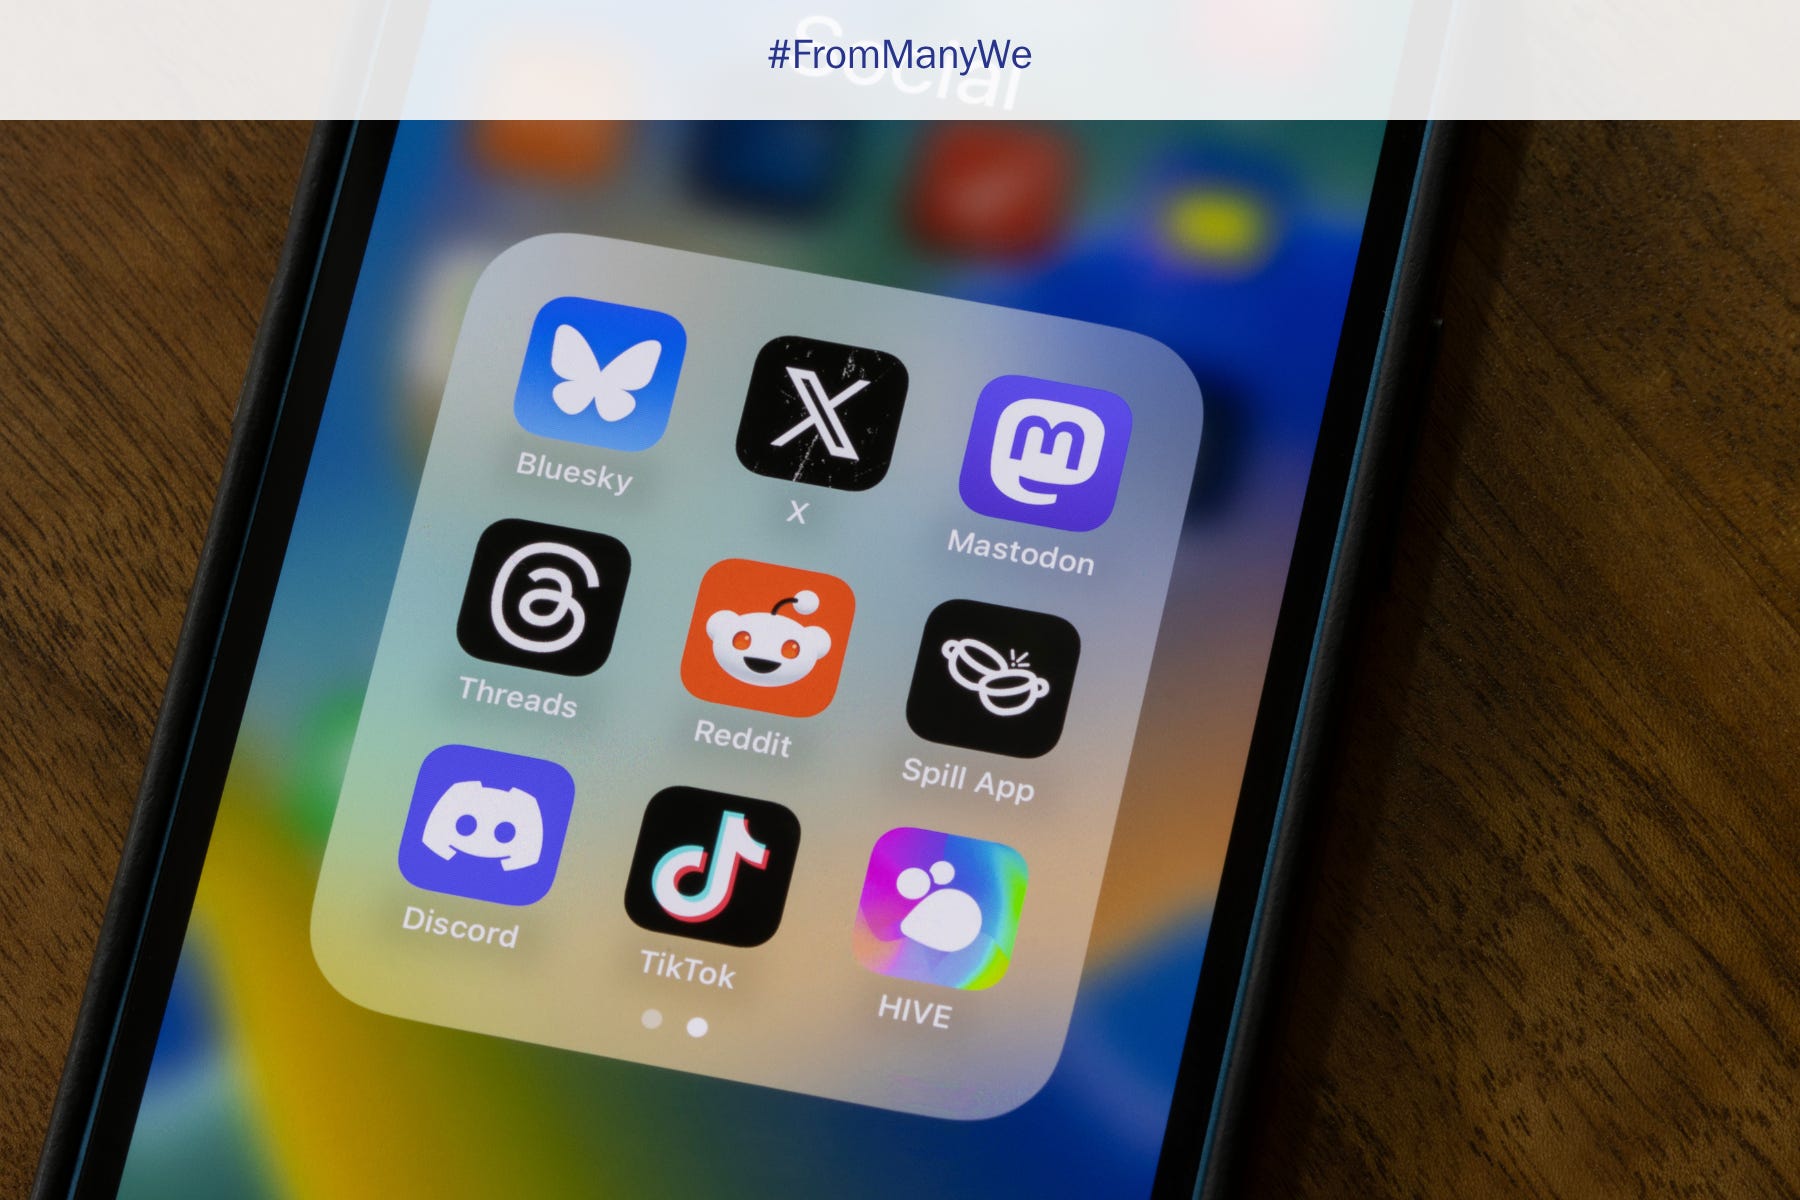
According to survey research conducted for the Democracy for All Project, a joint endeavor between the Charles F. Kettering Foundation and Gallup, heavy social media users are less satisfied with democracy and more likely to hold beliefs inconsistent with democratic norms. Which platforms are the most toxic for American democracy? Are the anti-democratic attitudes of users driven by platform algorithms or by users themselves?
A closer look at the data, available at Gallup’s research hub, reveals that collapsing support for democracy among social media users is explained primarily by their age and gender: the younger and more male a platform’s user base skews, the less likely its users are to show strong, consistent support for democratic norms and principles. This finding warns against over indexing on social media use as a factor in declining public support for democracy, and it suggests a need for more directly targeted interventions addressing political trends among young men.
What the Data Says
First, a recap. According to the Kettering-Gallup data, people who use social media more than an hour each day are more likely to believe that:
Political leaders should stick to their beliefs and avoid compromise, even if little gets done;
“Facts” are just opinions and points of view;
It is sometimes OK for people to use violence as a way to achieve a political goal;
Wealthy individuals and businesses should be able to use their power to advance political candidates and causes they support;
The news media should take more direction from the government when reporting the news;
And more power should be given to presidents and the executive branch to make the government more responsive, even if [respondents] often disagree with the president’s agenda.
The Democracy for All Project data revealed that heavy social media users were also less likely to agree with the statement, “Every citizen should have the right to vote, even if they are uninformed or hold radical views,” while also reporting more difficulty getting along with people who do not share their beliefs. And the more hours of social media use a respondent reported, the stronger these trends held. Further, social media users were less likely to agree that democracy is the “best form of government,” indicating dissatisfaction with the political system.
Social Media Is Complicated
What explains these findings?
Social media itself is a complex variable. YouTube, Facebook, and Instagram are the three platforms that survey respondents reported using most often, and all are quite different from one another. Each offers different mechanisms for users to act and interact, which scholars call “affordances.” Distinct affordances allow for, or even encourage, different types of user interactions.
Platforms may also attract different audiences for reasons that are communal, political, or ideological: some communities gather in niche groups on Discord or Reddit, while Bluesky and X users may be attracted to the ideological makeup of those platforms.
Attributing an attitude to “heavy social media users” may be painting with too broad of a brush. Looking more closely at the data from the Kettering-Gallup survey may tell a more fulsome story.
Diving into the Data
The data allows comparison of specific pairs of data points, but it is not the same as respondent-level microdata. It can answer questions like how underrepresented different age brackets, genders, or political orientations are on various social media platforms, but it cannot tell us (for example) how likely female TikTok users are to volunteer or if younger YouTube users are more likely to support political violence.
It can tell us how heavy social media users replied to two key items:
“Please indicate your level of agreement or disagreement: ‘Democracy is the best form of government.’ ”
“Whether or not you agree with current political leadership, how do you think US democracy is doing?”
Based on responses to these survey questions, this article presents respondents sorted into three groups based on whether or not they are committed (i.e., they agreed with question 1, above, that democracy is the best form of government) and their belief that US democracy is functioning (i.e., that US democracy is doing well, per question 2, above). The resulting three groups are “committed and functioning,” “committed and not functioning,” and “not committed and not functioning.” (A fourth group, “not committed and functioning,” has been excluded due to its low number of respondents.) The table below sorts the members of these groups by their rates of self-reported social media use.
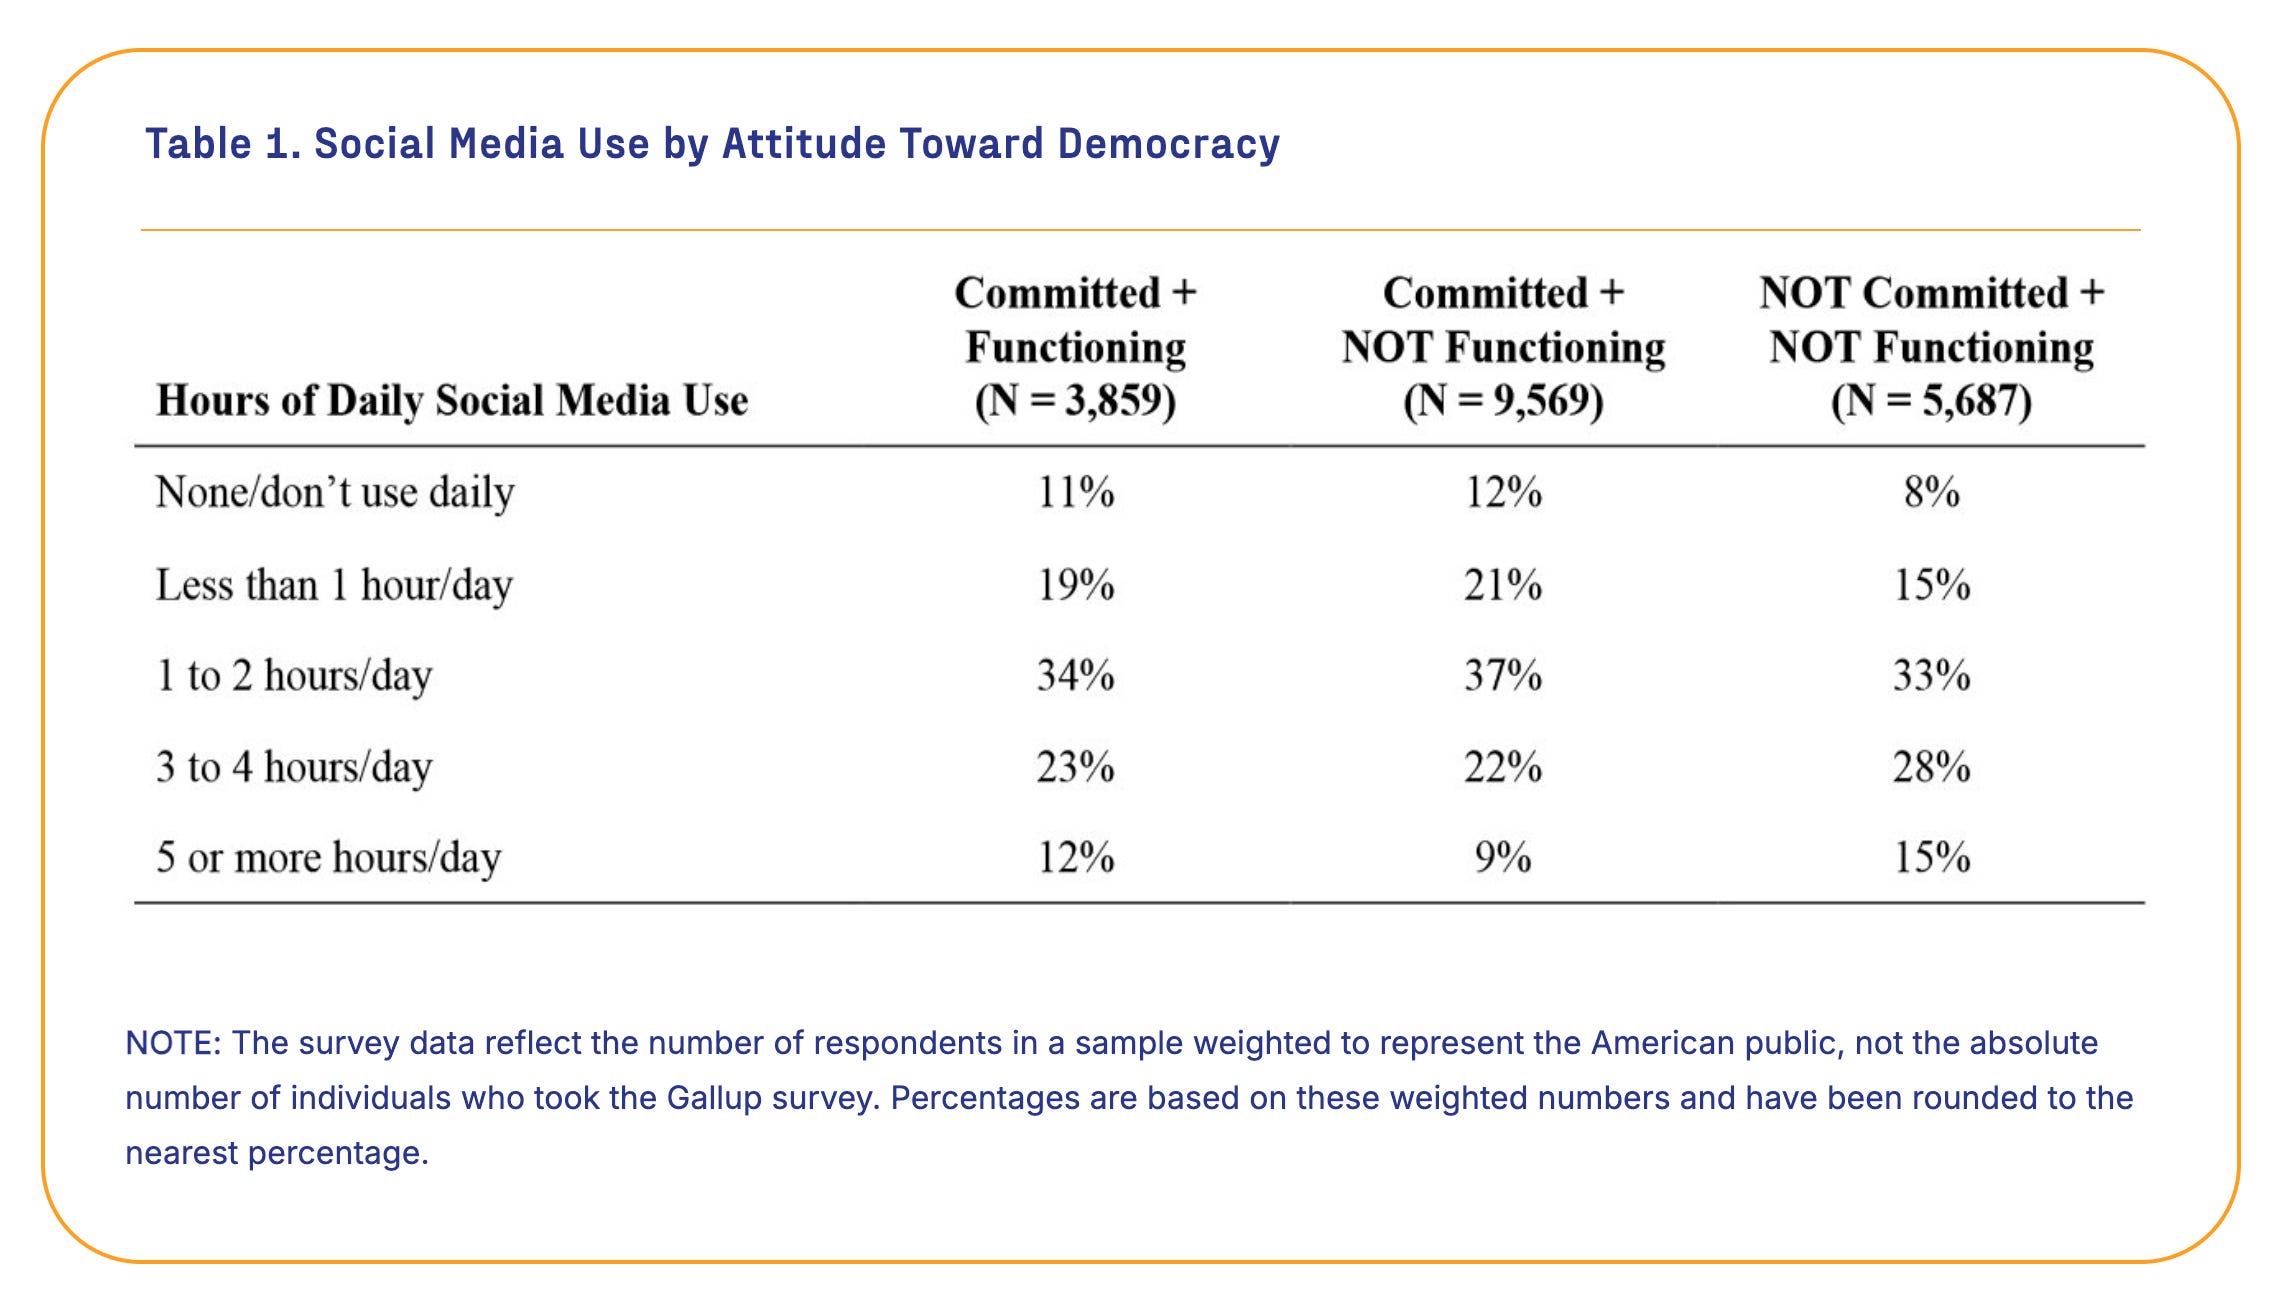
The clear pattern shown in table 1 is that heavier levels of social media use are correlated with lower commitment to democracy. But what do other demographics tell us about this story?
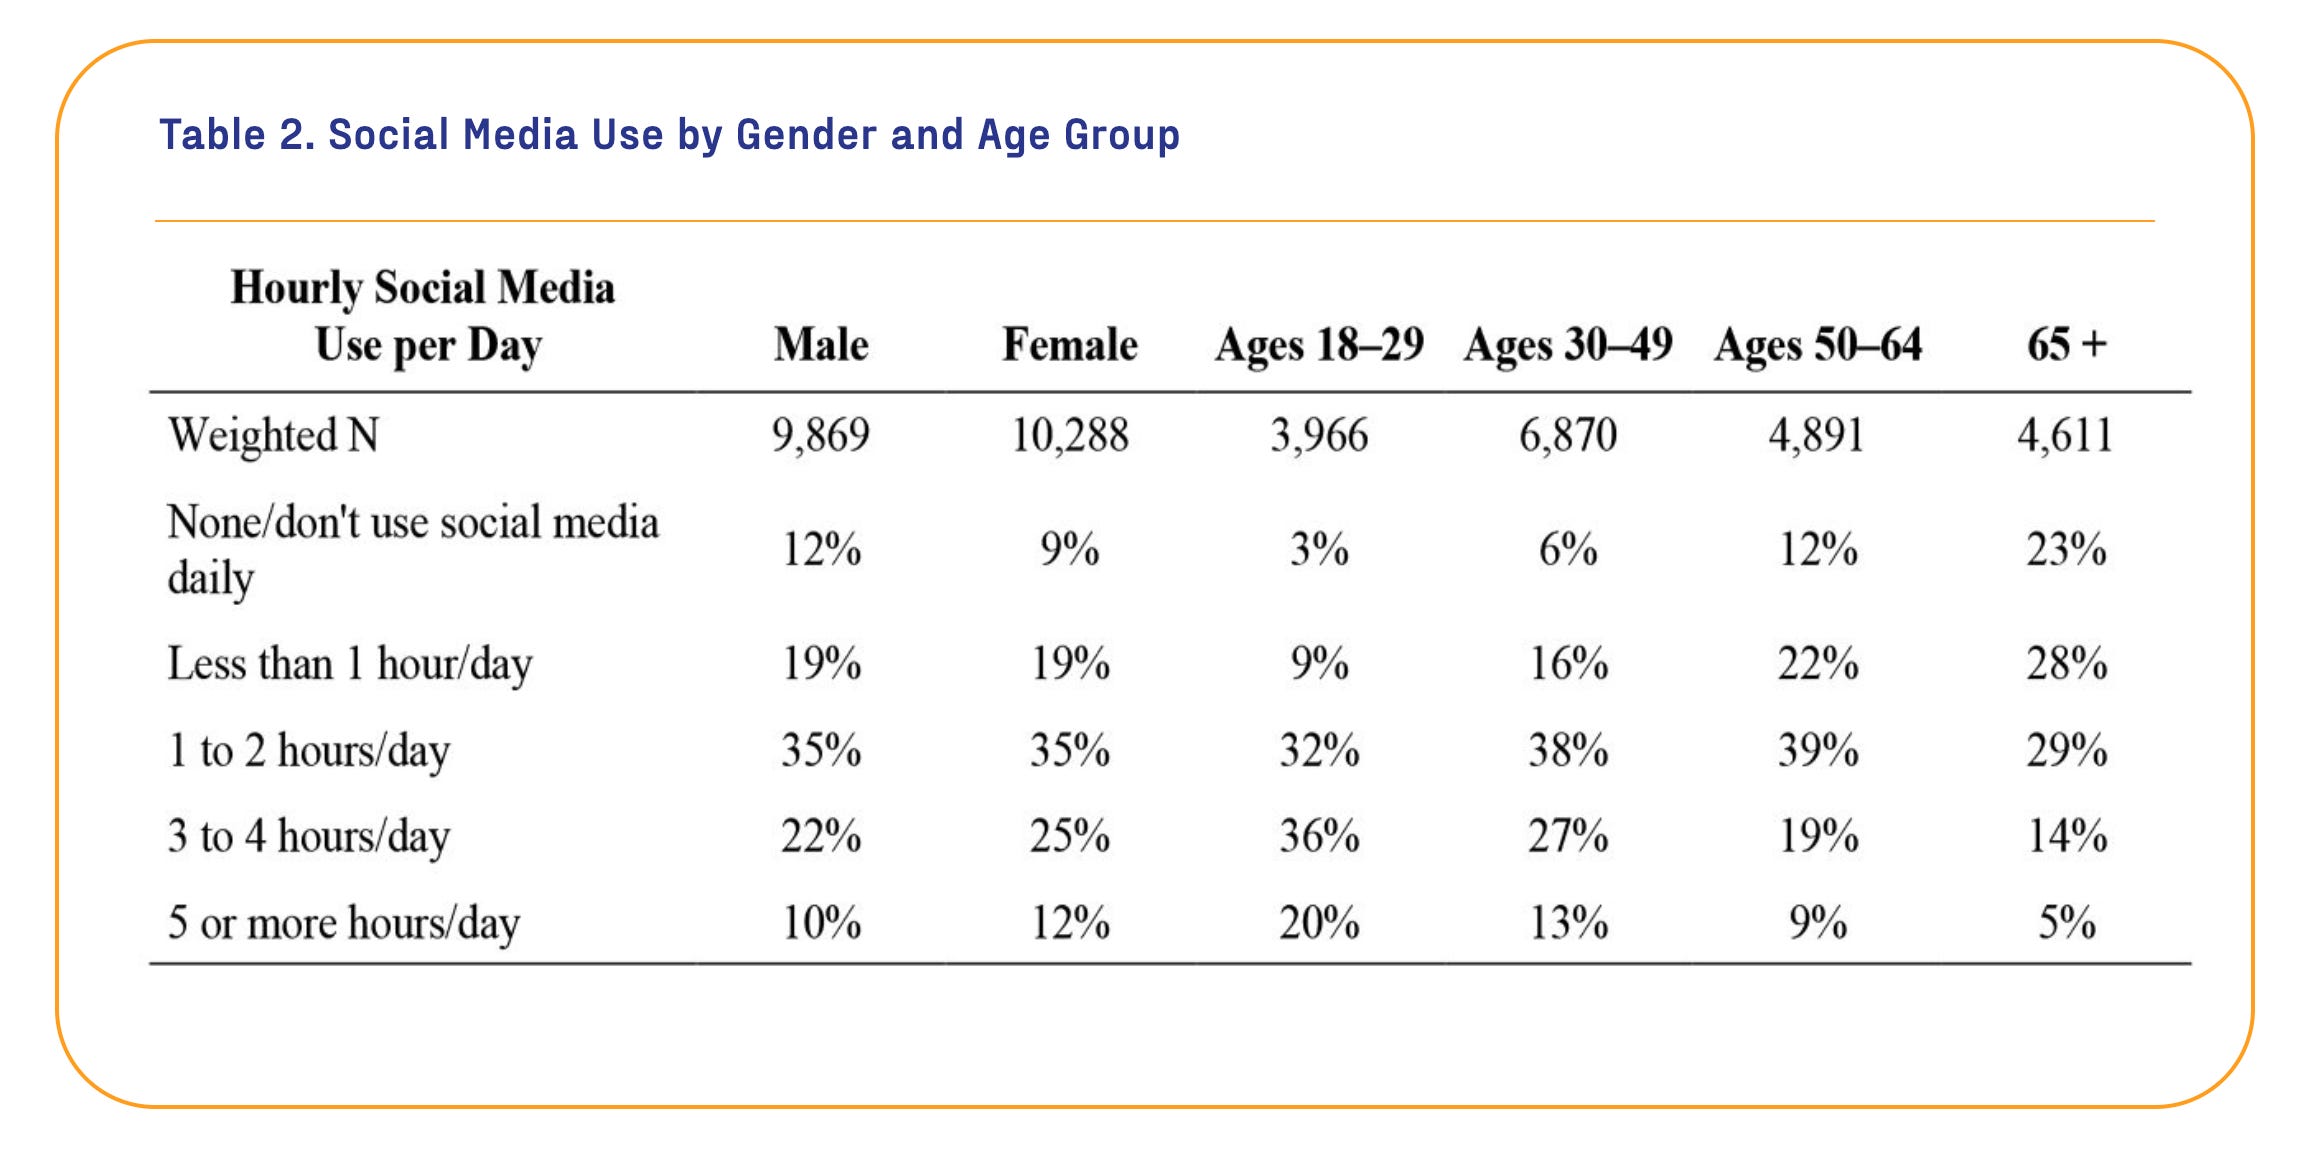
Two things stand out from table 2: younger people are more likely to use social media for three or more hours a day, and women are slightly more likely to be heavy users than men. Table 3 shows how people of different ages and genders sort into each of the groups described above.
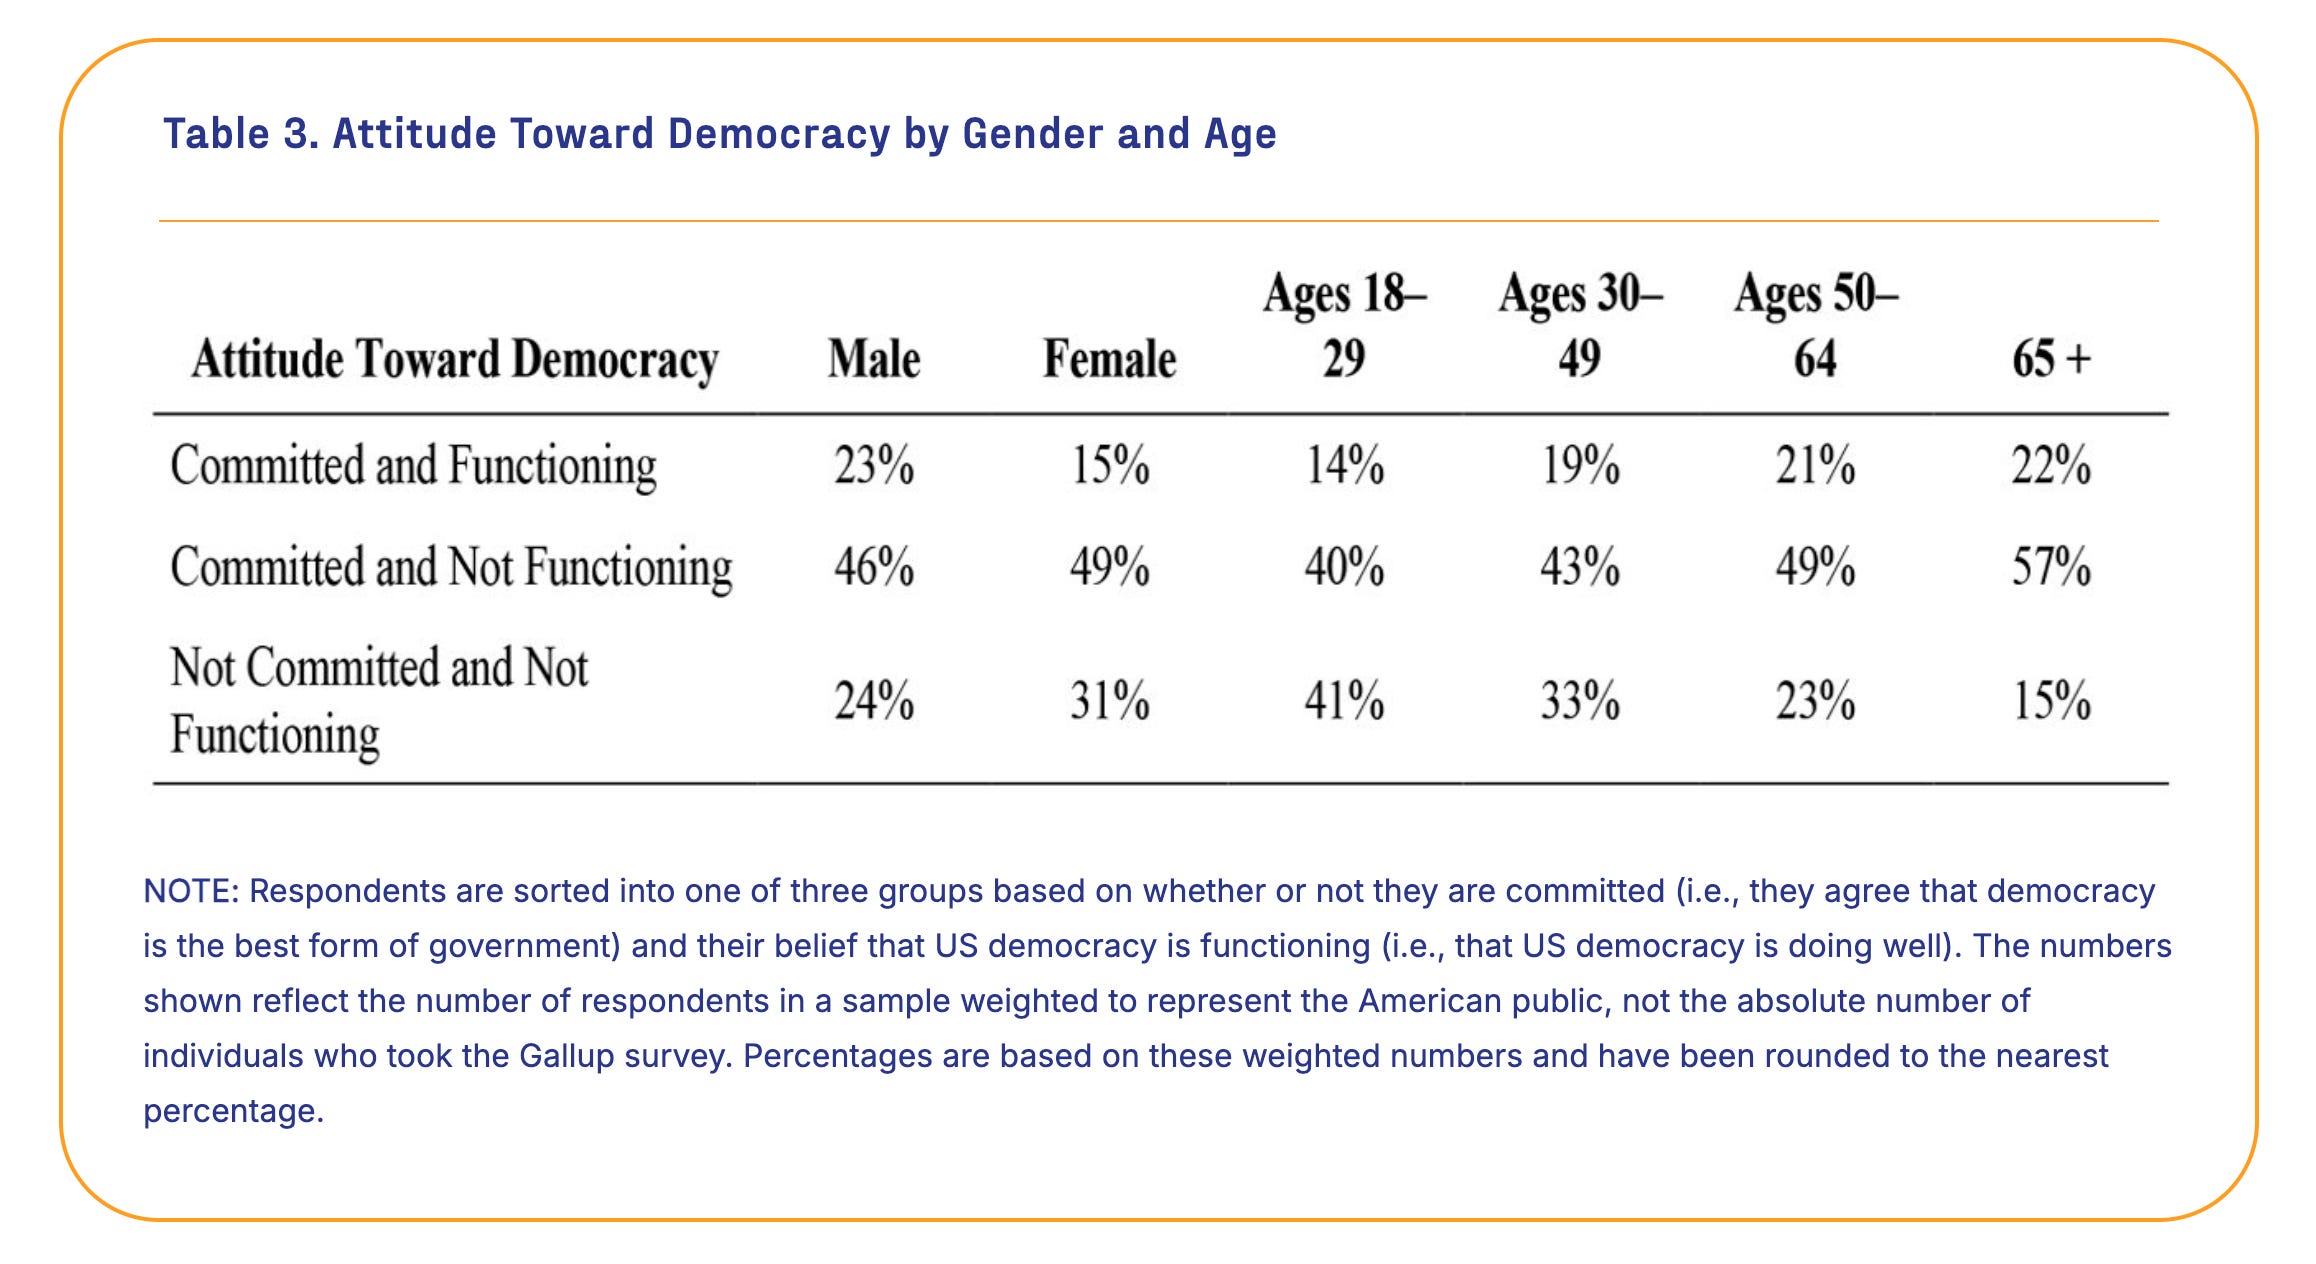
Young people overwhelmingly cluster in the “not functioning” group, but the only group where they are more likely to appear than older respondents are the “not committed” row. That is to say, more young respondents did not agree that democracy is the best form of government. As for gender, women were more likely than men to sort into the “not functioning” row regardless of commitment.
The data in the three tables above suggests serious dissatisfaction with democracy. Youth are also more likely to hold authoritarian beliefs; for example, younger respondents were more likely to agree with statements like, “It is sometimes OK for people to use violence as a way to achieve a political goal,” as were men (19.4% to 11.2%). Other authoritarian beliefs, such as “The US is weaker as a nation because it has people from different races, religions, and cultures,” have smaller gender gaps in the same direction (men are more likely to agree than women).
Without respondent-level microdata, we can’t press further ahead with questions like “which groups do young women select into?” But the data does suggest that our “social media and democracy” story has a serious youth component as well as a gender one.
Looking Across Platforms
The data also asked how often respondents used 14 platforms. To determine the relationship between these platforms and other variables, we can calculate the ratio of the rate at which a group uses a specific platform to the rate at which the full sample uses that platform; this is called an index. For example, to calculate how much more or less likely young people are to watch YouTube regularly, you would divide the rate at which young respondents watch YouTube regularly by the rate at which the full sample does. If the index is over one, then young people are more likely to use YouTube. If it’s less than one, they are less likely to be YouTube watchers.
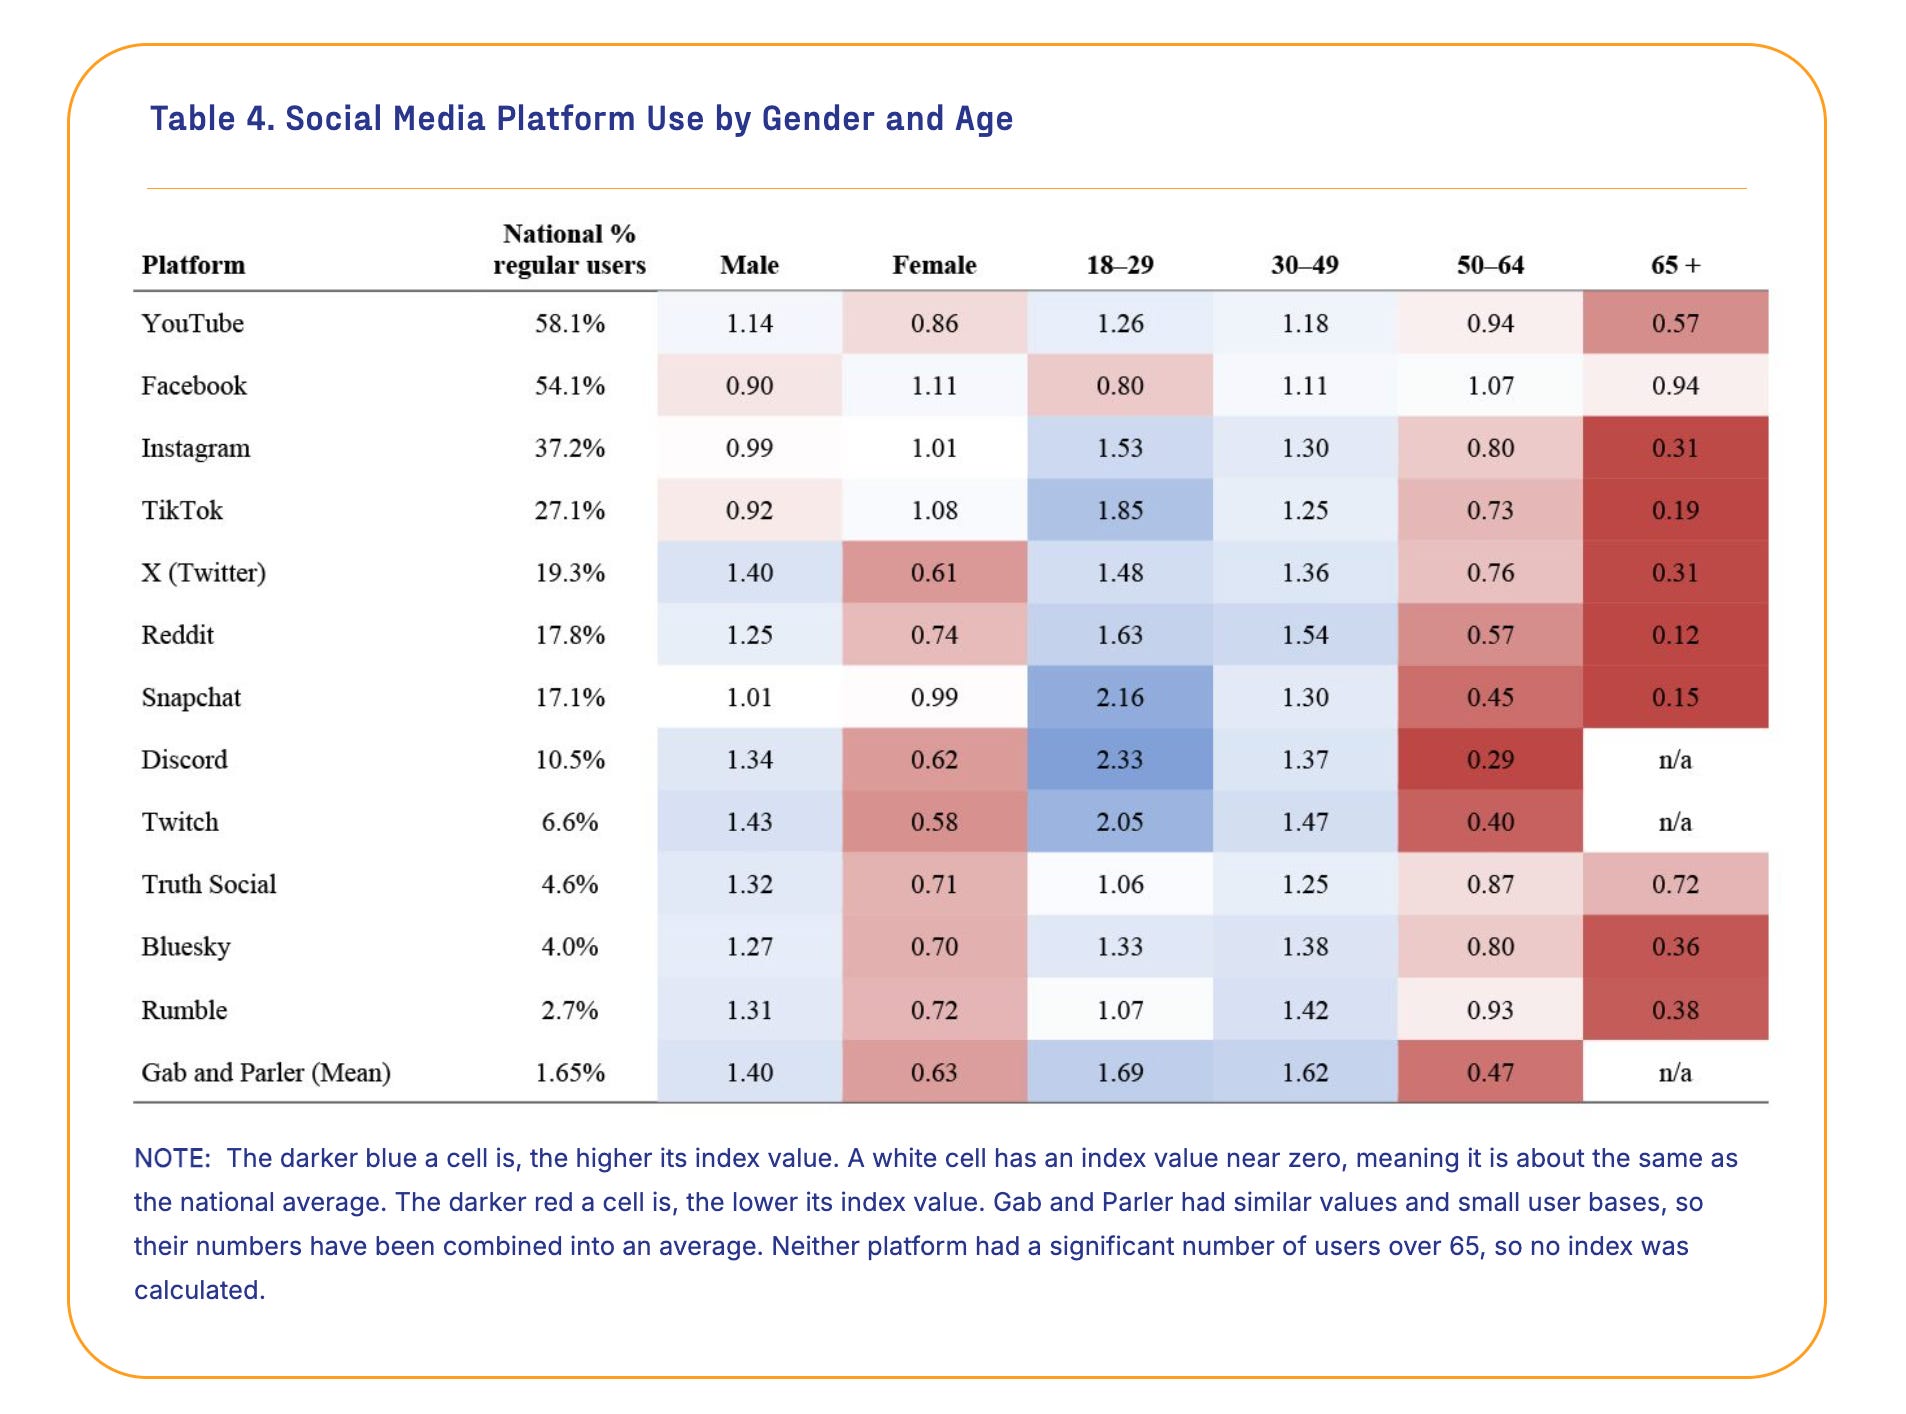
As table 4 above shows, young users are more likely to watch YouTube regularly, with an index of 1.26. But YouTube is not the platform with the youngest users; those are Discord (with an index of 2.33), Snapchat (2.16), Twitch (2.05), and TikTok (with an index of 1.85). Parler, Gab, and Reddit also have high youth indexes (1.73, 1.64, and 1.63). Parler, Gab, and Reddit are also more likely to be used by men.
Table 5, below, shows two sets of indexes for each platform: the first for how likely each group is to use a platform, and a second for how likely respondents with “consistent,” “ambivalent,” and “mixed” democratic values are to use the platform. Those stances toward democratic values reflect survey respondents’ support for statements related to democratic principles (e.g., “Citizens, including those who hold radical views, should be able to protest or speak out against the government as long as they do not engage in violence”). Respondents who uniformly and strongly supported these statements received a label of “consistent”; those who were inconsistent were labeled “mixed.” “Ambivalent” respondents were more likely to take noncommittal positions.
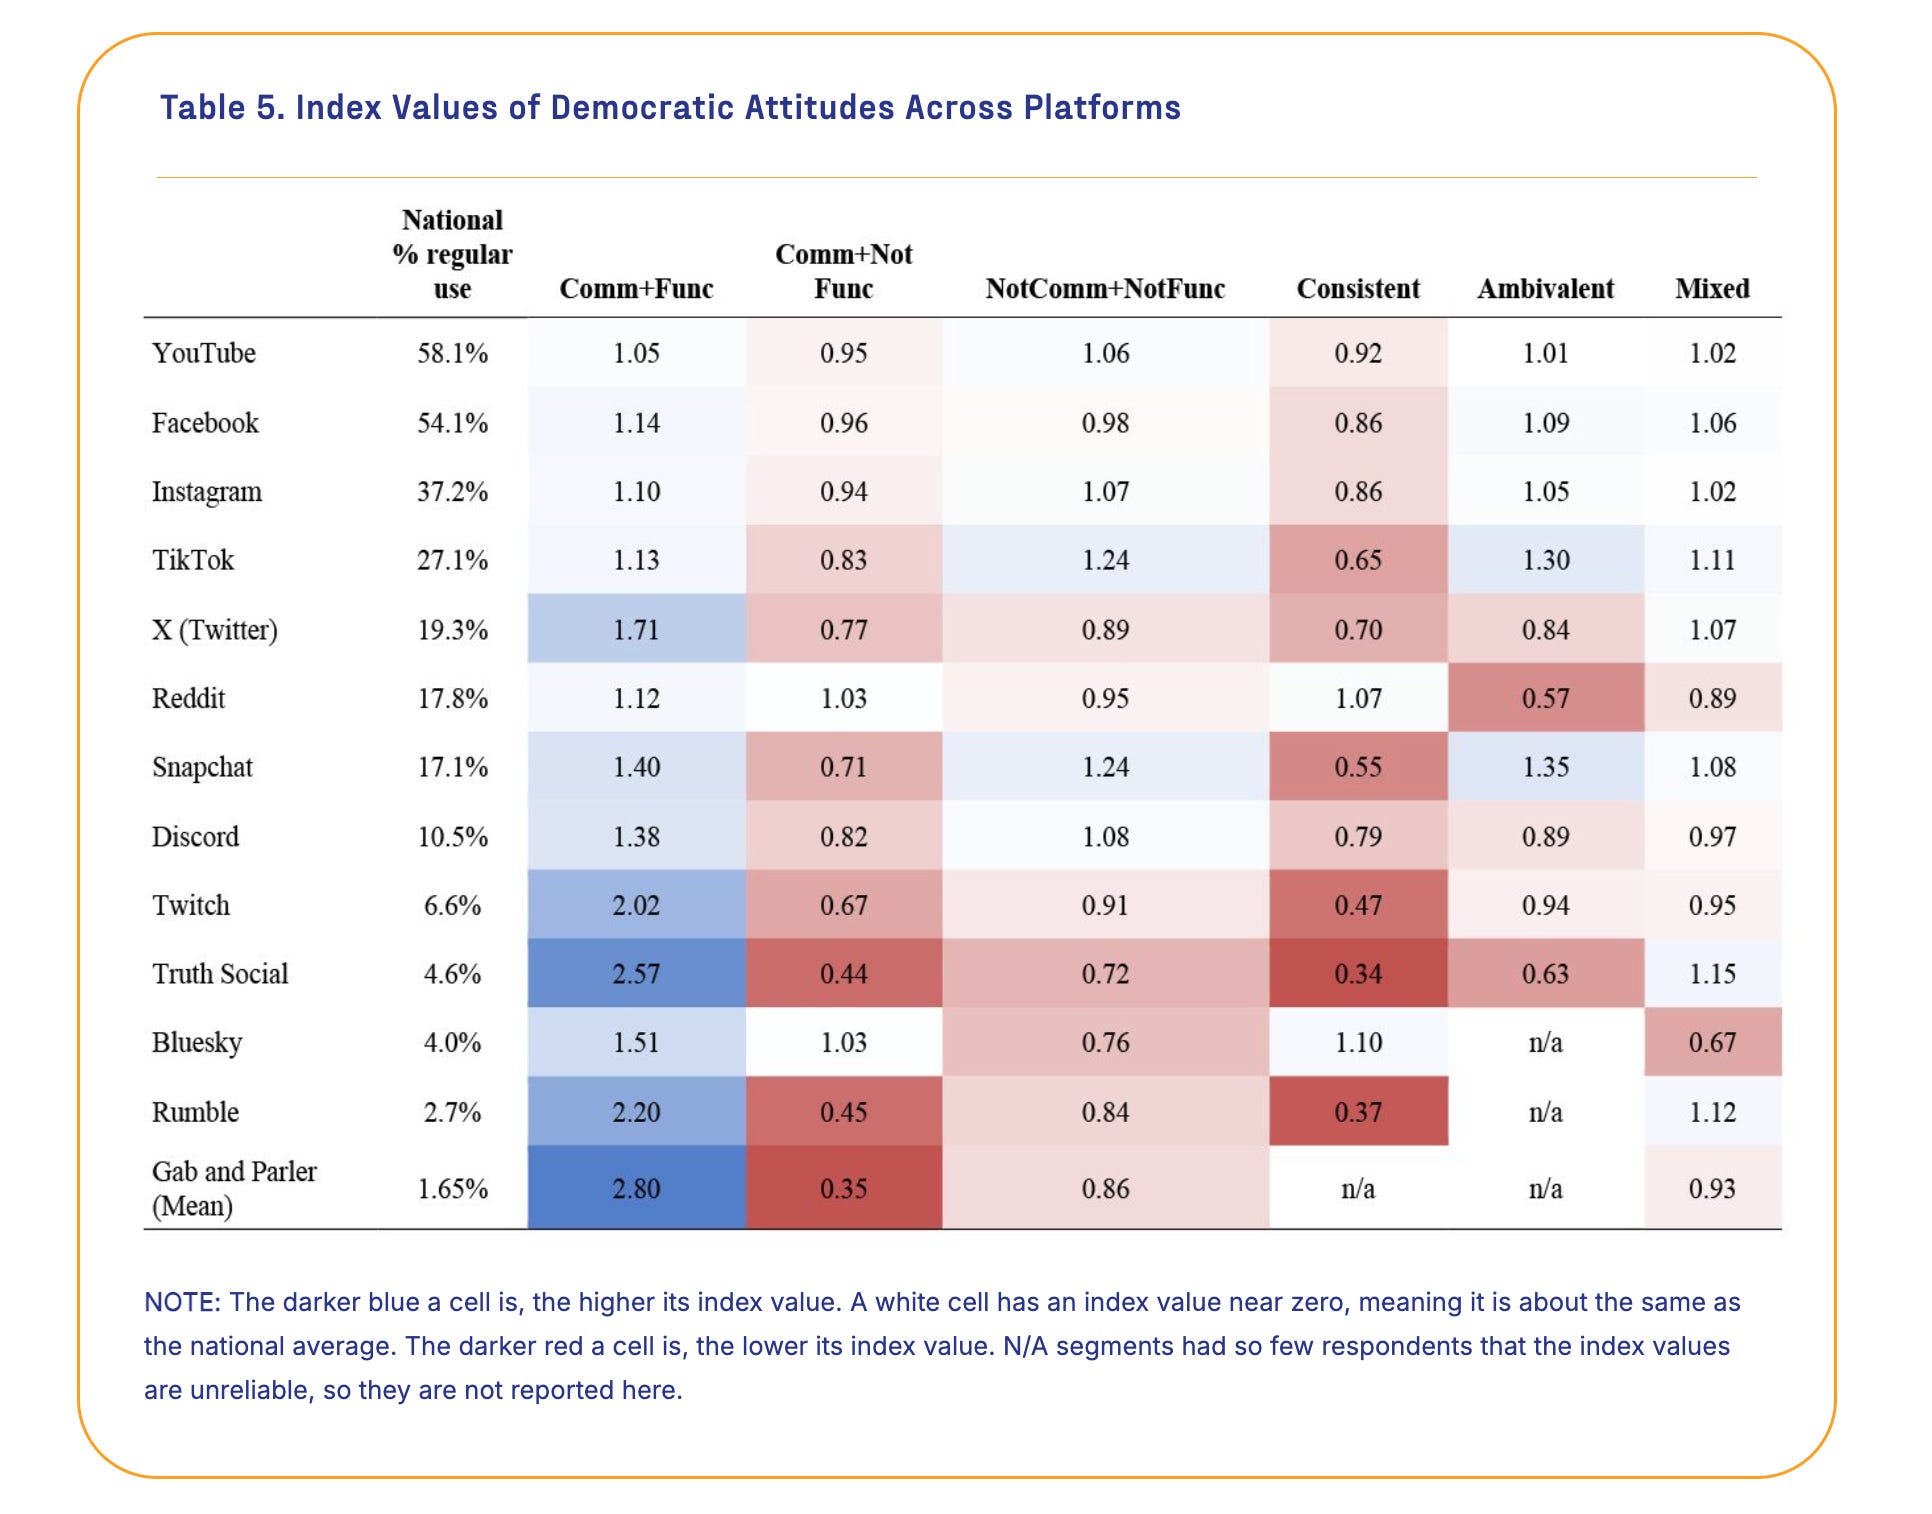
The youth variable also appears here: two of the platforms where young users are disproportionately likely to spend time, TikTok and Snapchat, have the highest indexes in the “Not committed, not functioning column,” as well as the highest indexes for ambivalence toward democratic principles.
A Partisan Shadow
The aftermath of the 2024 election casts a heavy partisan shadow over the data. Survey respondents in the “committed and functioning” group are more likely to use Truth Social, Rumble, Gab, or Parler than the average American. These right-leaning platforms have the highest index values in this row; each platform is over two. Looking across the data, Republicans are significantly overrepresented in this group; 47% of strong Republicans sit here as opposed to less than 10% for Democrats and “pure” independents. The “committed and not functioning” row shows the reverse: Democrats selected into this group at more than twice the rate of Republicans (65.9% to 30.1%) and by more than 20 percentage points more than independents (44.8%). Only two platforms topped an index of one: Reddit and Bluesky, and just barely at 1.03 each.
The probable explanation here is that Republican satisfaction with democracy rallied after the 2024 election, while Democrats’ satisfaction cratered. As for independents, heavy social media users who affiliated with neither major party were much less likely to say they believed democracy is the best form of government (39% to about 66% for the two major parties).
Self-identified Republicans were also more likely to agree with statements like, “More power should be given to presidents and the executive branch to make the government more responsive, even if I often disagree with the president’s agenda,” at just over 35% compared to under 14% for Democrats and independents. But heavy social media users as a group lean democratic (39% of Democrats say they use three or more hours a day, compared to 33% of Republicans and independents).
Which Way Does the Data Pull?
This piece opened with the question of why heavy social media users appear to be less satisfied with democracy and more tolerant of authoritarianism. Women and Democrats are more likely to report heavy social media use, but both groups are less likely to support authoritarian attitudes than men and Republicans. Independents are more likely to express dissatisfaction with democracy but less likely to use social media. So it seems unlikely that the explanation is primarily a function of gender or partisanship.
Age, however, exercises a powerful effect: young people are simultaneously more likely to be heavy social media users, more likely to be dissatisfied with democracy, and more likely to support authoritarian statements. The data reaffirms that youth disaffection is high—maybe high enough to be influencing rates for heavy social media users in general. It is noteworthy that the platforms where users are most likely to be disaffected skew younger and are more image- or video-centric.
The data also suggests, but cannot alone prove, that these trends are worse among young men, alongside troubling signs of support for violence and authoritarianism. The platforms most disproportionately favored by men are commonly associated with either the far-right (X, Truth Social, Rumble, Gab, and Parler) or gaming (Discord, Twitch). Many of these—Discord, Twitch, Gab, and Parler—also skew young.
Decision-makers who would like to address trends and attitudes in public support for democracy should take note of this possibility. Levers designed to change or reduce social media consumption in general may be less effective than hoped and could even have unanticipated, undesired side effects. For decision-makers working with limited resources to rebuild support for American democracy, understanding the relationships between partisanship, young men, and the platforms they disproportionately make up, is critical.
Dean Jackson is a senior fellow at the University of Pittsburgh’s Communication Technology Research Lab and at Tech Policy Press. In 2022, Jackson was an investigative analyst with the Select Committee to Investigate the January 6th Attack on the US Capitol.
From Many, We is a Charles F. Kettering Foundation blog series that highlights the insights of thought leaders dedicated to the idea of inclusive democracy. Queries may be directed to fmw@kettering.org.
The views and opinions expressed by contributors to our digital communications are made independent of their affiliation with the Charles F. Kettering Foundation and without the foundation’s warranty of accuracy, authenticity, or completeness. Such statements do not reflect the views and opinions of the foundation which hereby disclaims liability to any party for direct, indirect, implied, punitive, special, incidental, or other consequential damages that may arise in connection with statements made by a contributor during their association with the foundation or independently. The views and opinions expressed by contributors are likewise made independent of their affiliation with Gallup and without Gallup’s warranty of accuracy, authenticity, or completeness. Such statements do not reflect the views and opinions of Gallup, which hereby disclaims any association with or endorsement of such content.